Memory analysis in Rust
This is not a comprehensive guide to memory analysis in Rust, but rather a collection of tools and techniques I found helpful during a witch-hunt for memory issues in Forest. Most tools have documentation, likely dedicated guides and even entire books!
The problem
My Chrome tab is using so much memory!
You might be complaining about your Chrome tab using 2 GiB of memory, but have you ever tried running a Filecoin node? The minimum for mainnet starts at 8 GiB, and the more features you want to use, the more memory you will need. Some examples:
- Network upgrade for NV22 Smaug required at minimum 64 GiB; both Forest and Lotus. For the curious, it was due to a relatively complex state tree migration.
- Snapshot export in Forest requires ~16 GiB of memory. In Go implementations, it is significantly more. I don’t have the exact numbers because I don’t have enough RAM to test it. Sufficient to say, it’s substantially more than 64 GiB.
- Some niche JSON-RPC calls require a lot of memory, like
Filecoin.StateMarketDeals- given the API is not paginated, it will try to load all deals into memory, which can easily go over 64 GiB. There are some efforts to make the API more usable, see this experimental API PR
With all this in mind, it is essential to account for every single gigabyte of memory the node uses. After all, it’s one of the selling points of Forest: run a Filecoin node with fewer resources. Hell, run it on a Raspberry Pi! This is where memory analysis comes in handy.
But Rust prevents memory leaks, right?
Yes, Rust prevents memory leaks in the sense that it will not allow you to allocate memory and then forget about it, unless you use Box::leak, std::mem::forget or depend on faulty crates. For the latter, you might want to use cargo-geiger. However, Rust will not prevent you from creating a data structure and keep appending to it indefinitely, eventually leading to a beautiful OOM. A typical case in a long-running application that performs non-trivial operations is that you have a cache and keep adding to it. If it’s unbounded, you will have an OOM, sooner or later.
Memory profiling tools
Setup
You need to compile your program with debug symbols to get the most out of every tool. It makes sense to create a custom profile for this, e.g., profiling, in your Cargo.toml:
1
2
3
4
[profile.profiling]
inherits = "dev"
opt-level = 1
debug = true
This helps if your custom profile isn’t exactly the same as dev. For example, you need some optimisations so that the program runs fast enough to be useful, but you still want debug symbols.
Another thing to keep in mind is that some tools might work better with the system allocator rather than Rust’s default or your custom one, like jemalloc (the actual default on some platforms) or mimalloc. You can introduce a feature flag for this, e.g., system-allocator, and then use it in the code:
1
2
3
4
5
6
7
8
9
10
11
12
13
14
15
cfg_if::cfg_if! {
    if #[cfg(feature = "rustalloc")] {
      // uses the default Rust allocator
    } else if #[cfg(feature = "jemalloc")] {
        use tikv_jemallocator::Jemalloc;
        #[global_allocator]
        static GLOBAL: Jemalloc = Jemalloc;
    } else if #[cfg(feature = "system-alloc")] {
        use std::alloc::System;
        #[global_allocator]
        static GLOBAL: System = System;
    } else {
        compile_error!("You must enable one of the following features: `rustalloc`, `jemalloc`, or `system-alloc`");
    }
}
And in your Cargo.toml
1
2
3
[features]
...
system-alloc = []
Compile your program with the profiling profile and the system allocator feature:
1
cargo build --profile profiling --features system-alloc # you might need to add `--no-default-features`, depending on your setup
heaptrack
heaptrack - heaptrack-1.5.0
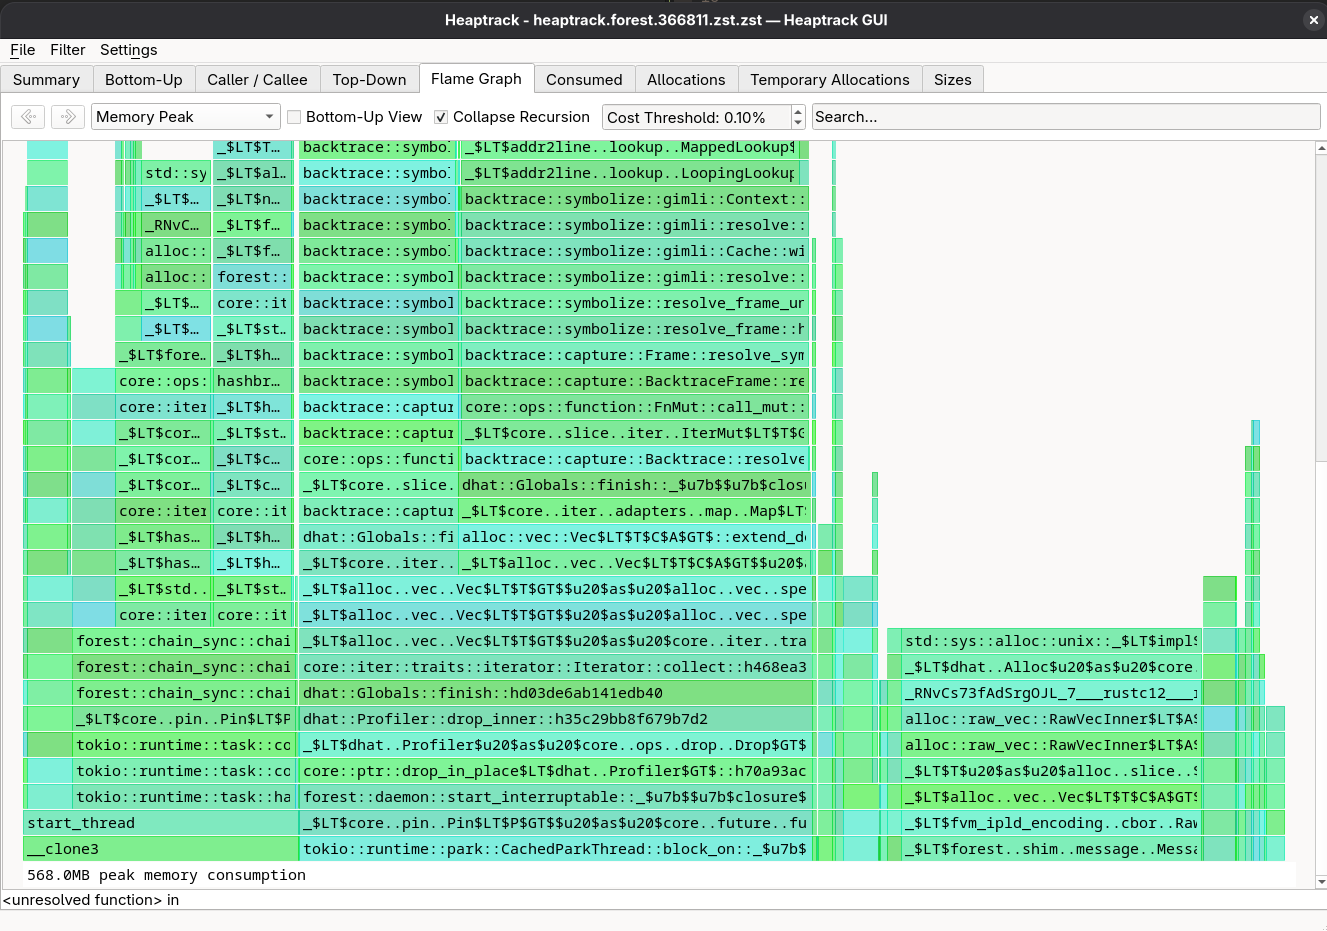
It’s the simplest tool to use. It works by running your program under heaptrack, which will record all memory allocations and deallocations, and then you can analyse the results with its interactive viewer. It also supports generating a flamegraph. It used to be my go-to tool for memory analysis, but it has a very high memory overhead, so it might not be suitable if your program is already memory-intensive, like a Filecoin node. In my attempts, it mostly crashed with an OOM error, even with a 64 GiB RAM machine. Sometimes my Fedora would hang, and I had to reboot it: instant +10 to burnout.
You can run it with heaptrack <program>; once closed, it will generate a file like heaptrack.<pid>.gz. You can then analyse it with heaptrack <file>. The analysis might take quite a while, so be patient. The output will look something like this:
Theoretically, you can attach to a running process with heaptrack --pid <pid>, but there’s an explicit warning that it might open a Pandora’s box of issues, so I wouldn’t recommend it.
When it works, it’s a great tool and my go-to for memory analysis. Unfortunately, it has some issues with memory overhead, so I had to look for alternatives.
gperftools & pprof
gperftools - gperftools-2.16
I’ve had quite a good experience with this tool. The setup is minimal, and there’s hardly any overhead. Every once in a while, it dumps the heap profile to a 1 MiB file, which can be inspected (without interrupting the program) with pprof.
1
Dumping heap profile to /tmp/gperfheap.forest.prof_10047.0167.heap (171024 MB allocated cumulatively, 184 MB currently in use)
You need to link your program with tcmalloc to set it up. You can do it, e.g., via a build script:
1
2
3
fn main() {
    println!("cargo:rustc-link-lib=tcmalloc");
}
There’s an issue with this tool in Rust. Essentially, it modifies one of the environmental variables and makes it a non-UTF-8 string, which causes crashes if any parts of your program do something crazy like environmental variable iteration. This is a known issue; see here. In the meantime, you can set
HEAPPROFILE_USE_PID=tbefore running your program.
Now, in your Makefile, you can add targets to build and run your program:
1
2
3
4
5
6
gperfheapprofile = cargo build --no-default-features --features system-alloc --profile=profiling --bin $(1); \
	ulimit -n 8192; \
	HEAPPROFILE_USE_PID=t HEAPPROFILE=/tmp/gperfheap.$(1).prof target/profiling/$(1) $(2)

gperfheapprofile.forest:
	$(call gperfheapprofile,forest, --chain calibnet --encrypt-keystore=false)
Run it with make gperfheapprofile.forest to start the program. It will dump the heap profile periodically, and you can inspect the dumps at any time. Let it run for a while and put some typical load on it to accumulate enough data to analyse.
Don’t use the default
pprofthat comes withgperftools, e.g., one provided by your distribution like Fedora. It’s an outdated, slow Perl script. Instead, use Google’s pprof as suggested in the gperftools README.
Now, analyse the dump using pprof. I prefer the web interface, but you might tinker with other options.
1
2
# Note that you need the binary with debug symbols, so use the profiling profile mentioned earlier.
pprof -http=localhost:8080 target/profiling/forest gperfheap.forest.prof_10047.0167.heap
This will start a web server on localhost:8080 where you can interactively inspect the memory usage of your program.
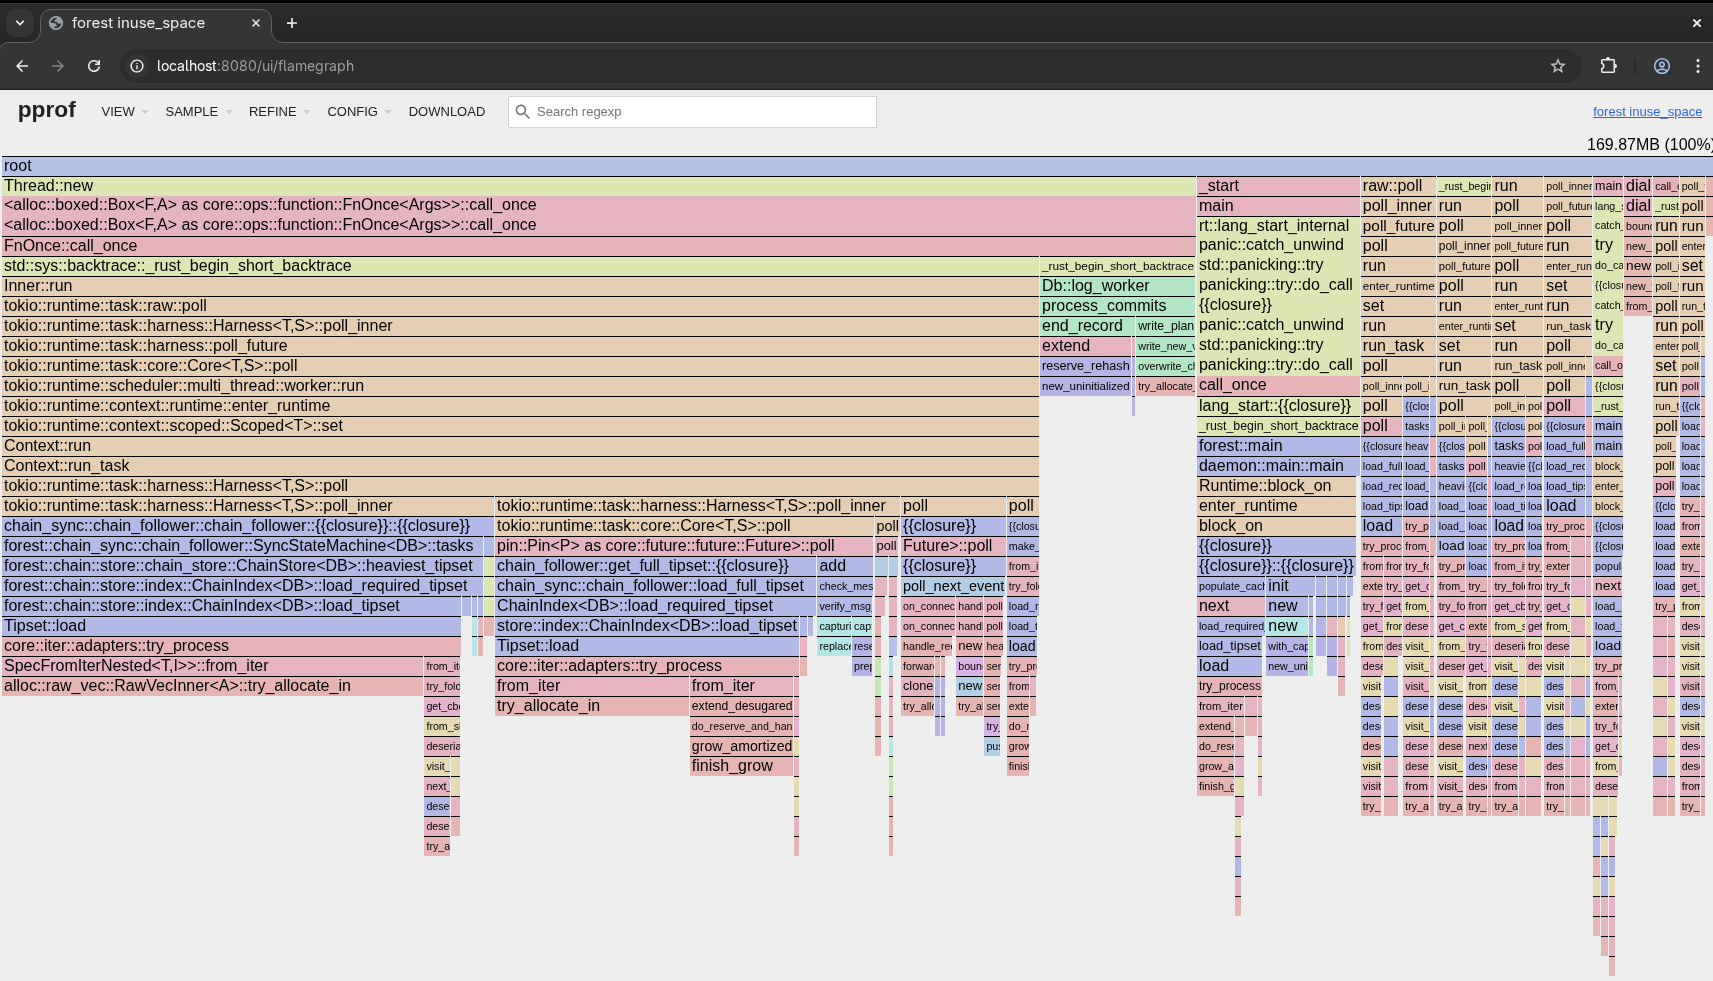
Here, you can see that quite a bit of memory is used from the load_required_tipset (and a bunch of others - one needs to follow the call stack with the code to understand what is going on and mentally filter all tokio tasks). This makes sense, because there’s a cache:
1
2
3
4
5
6
7
8
9
10
11
12
13
14
15
16
17
18
19
20
21
22
    /// Loads a tipset from memory given the tipset keys and cache. Semantically
    /// identical to [`Tipset::load`] but the result is cached.
    pub fn load_tipset(&self, tsk: &TipsetKey) -> Result<Option<Arc<Tipset>>, Error> {
        if !is_env_truthy("FOREST_TIPSET_CACHE_DISABLED")
            && let Some(ts) = self.ts_cache.lock().get(tsk)
        {
            metrics::LRU_CACHE_HIT
                .get_or_create(&metrics::values::TIPSET)
                .inc();
            return Ok(Some(ts.clone()));
        }

        let ts_opt = Tipset::load(&self.db, tsk)?.map(Arc::new);
        if let Some(ts) = &ts_opt {
            self.ts_cache.lock().put(tsk.clone(), ts.clone());
            metrics::LRU_CACHE_MISS
                .get_or_create(&metrics::values::TIPSET)
                .inc();
        }

        Ok(ts_opt)
    }
An environmental variable can turn off the cache at a cost of performance. In this case, it’s discouraged as the performance impact is so great that the node might not be able to keep up with the network.
dhat crate
dhat - dhat-0.3.3
It’s not mentioned in the crate’s documentation, but you need the
tcmallocshared library on the host. On Fedora, it’s under thegperftools-develpackage.
This requires a different setup than what was mentioned at the beginning. All information is in the dhat documentation. The gist is that you must add dhat to your dependencies, set it up as a global allocator, and start it at the beginning of your program. Note that the dhat allocator is slower than the standard allocator, so it should be used only for profiling.
It might be that the slowdown is not acceptable for your use case, or you want to profile a specific part of the code, in which case you might want to use ad hoc profiling. This allows you to annotate the hot spots in your code with dhat::ad_hoc_event.
The output is a bit old-school, similar to valgrind output, but it can do the job. See the DH manual.
A unique feature of the crate is that you can write tests with it to check the amount of memory allocations. For example, you can write a test that asserts that the code doesn’t allocate more than 10 MiB of memory:
1
2
3
4
5
6
7
8
9
10
11
12
13
14
#[global_allocator]
static ALLOC: dhat::Alloc = dhat::Alloc;

#[test]
fn test() {
    let _profiler = dhat::Profiler::builder().testing().build();

    some_function_that_should_not_allocate_more_than_10_mib();

    let stats = dhat::HeapStats::get();

    // At the point of peak heap size, no more than 10 MiB should've been allocated.
    dhat::assert!(stats.max_bytes <= 10 * 1024 * 1024, "Memory usage exceeded 10 MiB");
}
In case of failure:
1
2
3
4
5
6
7
8
---- test stdout ----
dhat: Total:     11,534,336 bytes in 1 blocks
dhat: At t-gmax: 11,534,336 bytes in 1 blocks
dhat: At t-end:  0 bytes in 0 blocks
dhat: The data has been saved to dhat-heap.json, and is viewable with dhat/dh_view.html

thread 'test' panicked at src/main.rs:20:5:
dhat: assertion failed: stats.max_bytes <= 10 * 1024 * 1024: Memory usage exceeded 10 MiB
This is a great way to ensure that your code doesn’t accidentally allocate too much memory, and it can be used in CI to catch regressions. Even better, you won’t have to read posts like this one!
valgrind - massif
valgrind - valgrind-3.25.1
It’s more of an honourable mention. I failed to get it working with Forest; it’d just hang indefinitely. I decided not to spend more time on it. You might have better luck with it. Add this to your Makefile:
1
2
3
4
5
6
7
8
memprofile-massif = cargo build --no-default-features --features system-alloc --profile=profiling --bin $(1); \
                   ulimit -n 8192; \
                   rm massif.out.*; \
                   valgrind --tool=massif target/profiling/$(1) $(2); \
                   ms_print massif.out.* > /tmp/massif.$(1).txt

memprofile-massif.mybin:
  $(call memprofile-massif,mybin)
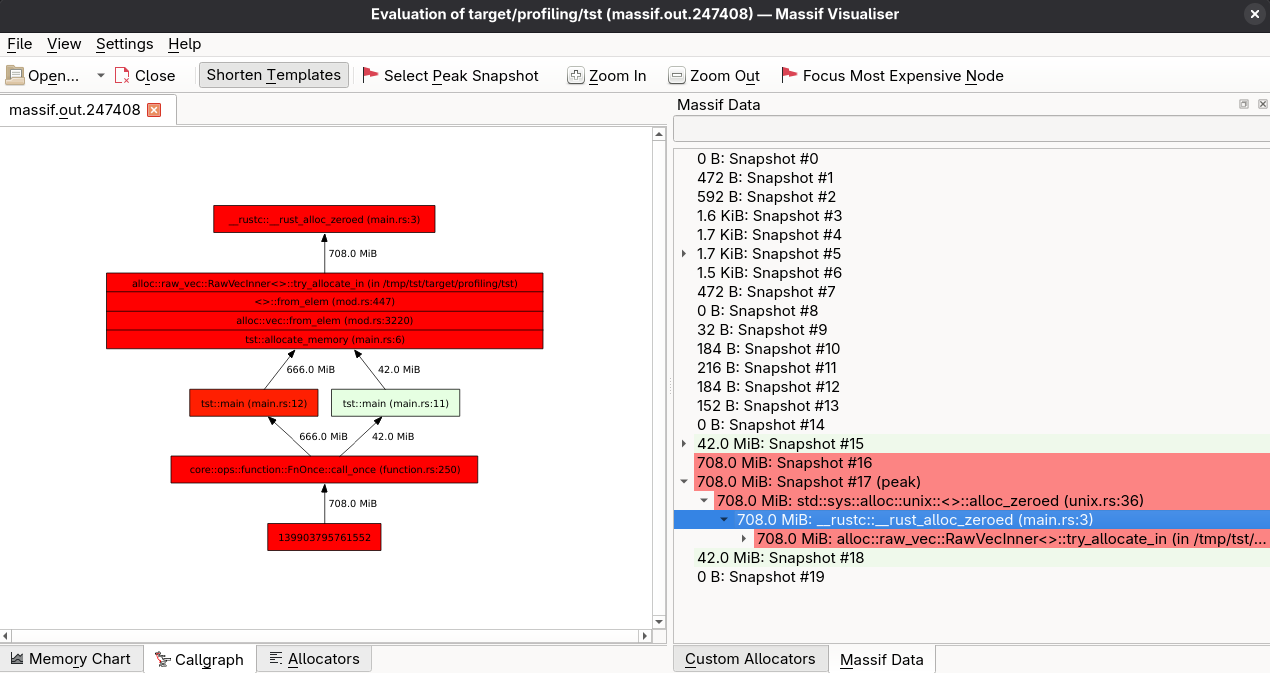
Then run it with make memprofile-massif.mybin and check the output in /tmp/massif.mybin.txt. Sample output is lengthy, but you can check it here. The entire allocation is done in the allocate_memory function:
1
2
3
4
5
6
7
8
9
10
11
12
13
use std::alloc::System;
#[global_allocator]
static GLOBAL: System = System;

fn allocate_memory(size: usize) -> Vec<u8> {
    vec![0; size * 1024 * 1024] // Allocate `size` MB of memory
}

// massif should report 708 MiB allocated in total
fn main() {
    let _v1 = allocate_memory(42); // 42 MiB
    let _v2 = allocate_memory(666); // 666 MiB
}
Massif output:
1
2
3
4
5
6
7
8
9
10
11
12
--------------------------------------------------------------------------------
  n        time(i)         total(B)   useful-heap(B) extra-heap(B)    stacks(B)
--------------------------------------------------------------------------------
 16        352,413      742,399,888      742,391,808         8,080            0
 17        352,594      742,399,888      742,391,808         8,080            0
100.00% (742,391,808B) (heap allocation functions) malloc/new/new[], --alloc-fns, etc.
->100.00% (742,391,808B) 0x40020B4: std::sys::alloc::unix::<impl core::alloc::global::GlobalAlloc for std::alloc::System>::alloc_zeroed (unix.rs:36)
| ->100.00% (742,391,808B) 0x4002611: __rustc::__rust_alloc_zeroed (main.rs:3)
|   ->100.00% (742,391,808B) 0x4030786: alloc::raw_vec::RawVecInner<A>::try_allocate_in (in /tmp/tst/target/profiling/tst)
|     ->100.00% (742,391,808B) 0x4001E64: <u8 as alloc::vec::spec_from_elem::SpecFromElem>::from_elem (mod.rs:447)
|       ->100.00% (742,391,808B) 0x400273E: alloc::vec::from_elem (mod.rs:3220)
|         ->100.00% (742,391,808B) 0x4002493: tst::allocate_memory (main.rs:6)
Quick sanity check:
\[742,391,808 \text{ B} = 708 \text{ MiB} = 42 \text{ MiB} + 666 \text{ MiB}\]The math checks out. Oof!
You can also use the massif-visualizer. It’s not as feature-rich as heaptrack, but it can be useful for quick analysis.
Other tools
Other than the tools mentioned above, I got some potential recommendations from the community, but I haven’t had a chance to try them (yet):
- bytehound - some legwork needed to set it up, as it requires a specific, old version of
mimalloclibrary on the host for compilation. It looks promising, though it hasn’t received any updates since 2023. According to the author, it is finished. - Tracy Profiler + Tracing-Tracy - supposedly great combo for profiling asynchronous
tokiocode annotated with tracing spans. - eBPF - this was recommended several times on the Reddit post as the modern way, with tooling like OTEL eBPF, Aya, bpftrace (easy but limited) and bcc (powerful but more painful). I haven’t tried it, but it looks like a powerful toolbox for profiling. The fact that there’s even a ePBF book about it makes it pretty daunting!
Hic Sunt Dracones
The profilers will not report everything. For example, memory-mapped files will not be reported. This is annoying because these tools might tell you that your program uses 200 MiB of memory, but then you check the memory usage with htop, and it shows over 2 GiB.
You can use smaps to check the mappings of your process. With a simple smaps Ruby wrapper, you can see what is happening:
1
2
3
4
5
6
7
8
9
10
11
12
13
14
15
16
17
hubert@fuzzy:~/prj$ sudo ruby cached_mappings.rb 10047 10

Top 10 file-backed memory mappings (by cached memory):
 Memory (MB)    Rss (MB)  Mapping Path
------------------------------------------------------------
       237.6       237.6  /home/hubert/no-kad-test/mainnet/0.27.0/table_00_9a
       148.5       148.5  /home/hubert/no-kad-test/mainnet/0.27.0/table_00_f3
       141.8       141.8  /home/hubert/no-kad-test/mainnet/0.27.0/table_00_ed
       129.1       129.1  /home/hubert/no-kad-test/mainnet/0.27.0/table_00_fc
        93.2        93.2  /home/hubert/no-kad-test/mainnet/0.27.0/table_00_ab
        64.0       156.0  /home/hubert/no-kad-test/mainnet/0.27.0/index_00_17
        58.7        58.7  /home/hubert/no-kad-test/mainnet/0.27.0/table_00_99
        57.8       660.0  /home/hubert/prj/forest/target/profiling/forest (deleted)
        57.3        57.3  /home/hubert/no-kad-test/mainnet/0.27.0/table_00_56
        42.9        42.9  /home/hubert/no-kad-test/mainnet/0.27.0/table_00_ff
------------------------------------------------------------
      1030.8      1725.0  TOTAL (Top 10)
At least in Forest’s case, it’s not a huge deal because the memory-mapped files are used for caching and are not leaked. The system will reclaim the memory when needed. It is still essential to be aware of this, though, as it can lead to confusion (yes, speaking from experience) when analysing memory usage.
Avoiding memory issues
Memory analysis aside, having all persistent collections bound is a good idea so that you could skip the analysis altogether. Some suggestions based on the memory analysis done in Forest:
- Use an lru or its variants for caching. Don’t implement them yourself; use battle-tested libraries like lru or cached.
- Monitor the size and length of your caches, e.g., via Prometheus metrics. Calculating the total size of a data structure can be tricky, but some libraries can help, such as get-size2. This will require some manual annotation, but it is worth it.
- Don’t use unbounded channels, like flume::unbounded, unless you are confident they won’t grow indefinitely. Ban their usage in your codebase with clippy’s disallowed-methods.
- Use reference-counted types like
ArcorRcto limit the number of copies of the data you have in memory. - Consider using pointers, e.g.,
Box, for keys and values in your data structures, especially if the data types are large. This will reduce the memory taken via calls likewith_capacityif the entire capacity is not always filled. - Consider using linked lists for more efficient memory usage. You can use hashlink for an LRU cache that uses linked lists internally. Note, this might save memory at the cost of performance, so you need to benchmark it for your use case.
All these suggestions won’t prevent all possible memory issues (see this one), but they will help you avoid the memory analysis legwork.
Conclusion
Memory analysis in Rust is not as straightforward as in some other languages, e.g., JVM-based. Still, plenty of tools and techniques can help you understand and optimise memory usage in your Rust programs. Once you’re done with the analysis, you will significantly reduce your program’s memory usage, leading to better performance and lower resource consumption. Who knows, maybe you’ll even convince your boss to rewrite their bloated Java application in Rust! 🦀